Put anything you can imagine on a 64×32 LED panel
DataPix is an ESP32-based RGB matrix ticker with a full configuration interface served from the device itself. Feed it any JSON API and choose the exact values to show, paint your own pixel art, and draw your own animations — frame by frame, no code. The only limit is imagination.
A simulation — the real panel auto-rotates your views like this.
Get DataPix — buy more, save more
€129
€239 (€119.50 each)
€349 (€116.33 each)
Ships worldwide, checkout via Stripe. Full pricing & details →
DataPix is under active development — new effects, sensors, view types and bugfixes ship as free over-the-air firmware updates.
See it in 30 seconds
From the config page to the panel, in one loop.
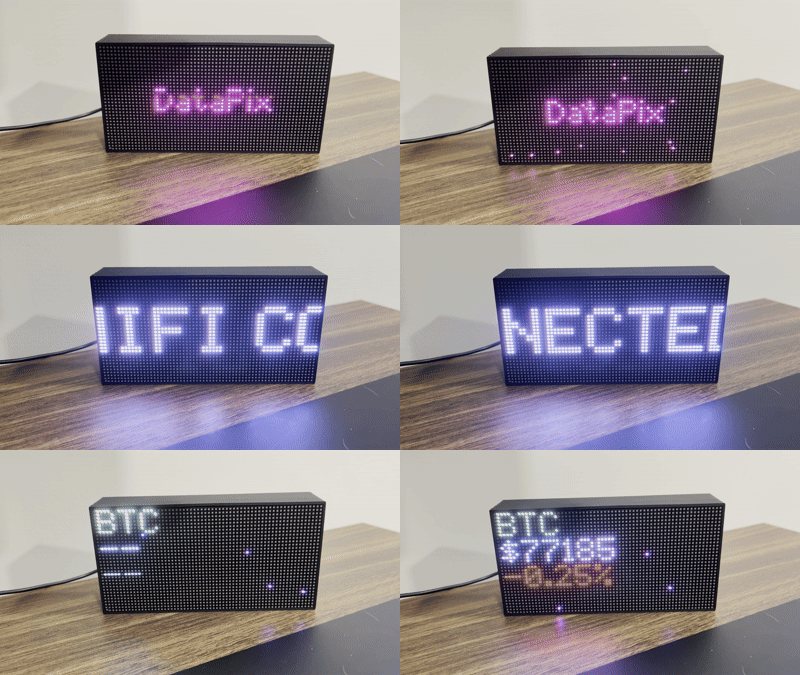
Put anything you can imagine on a 64×32 LED panel.
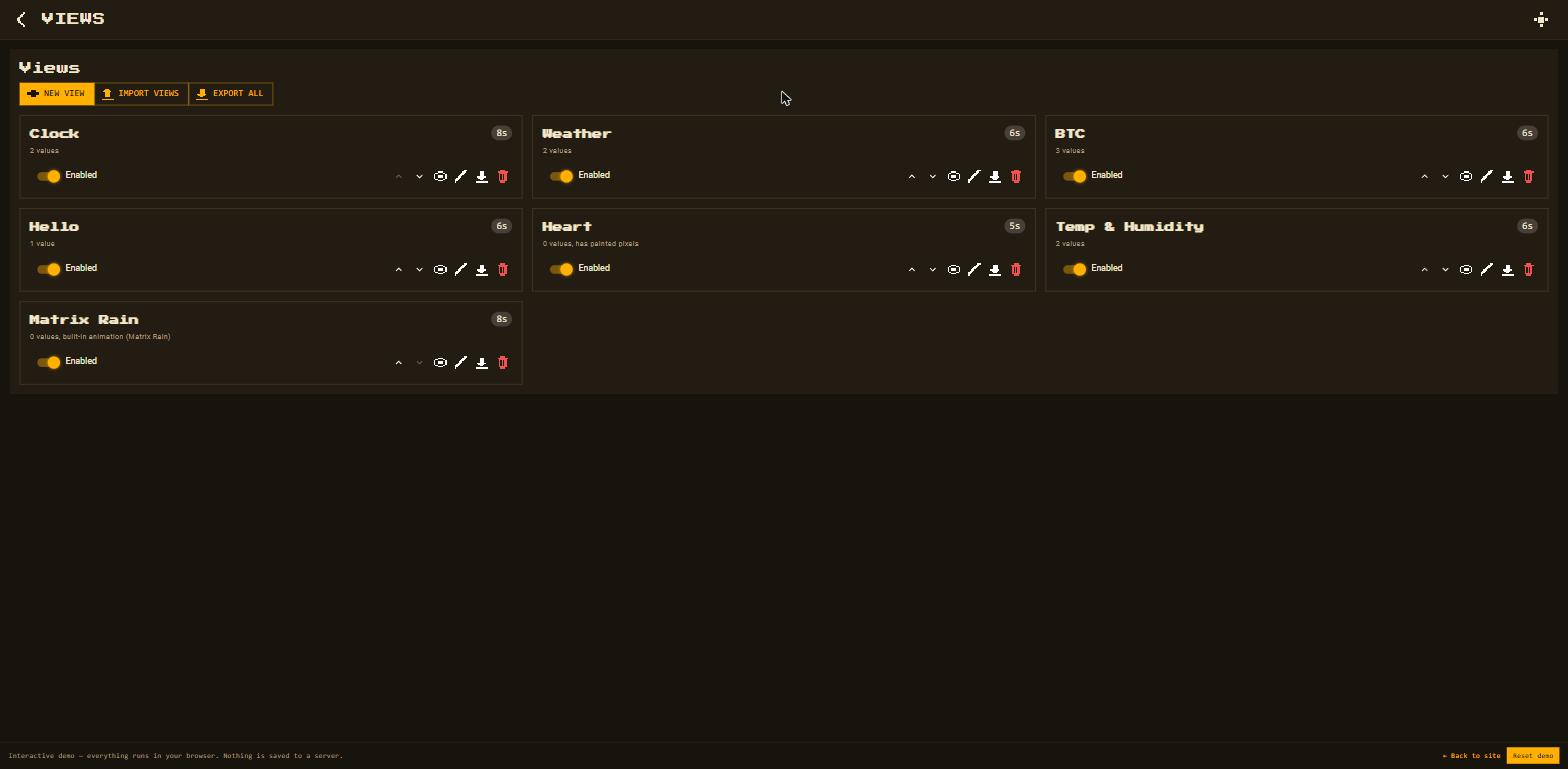
Configure it from a page the device hosts itself.
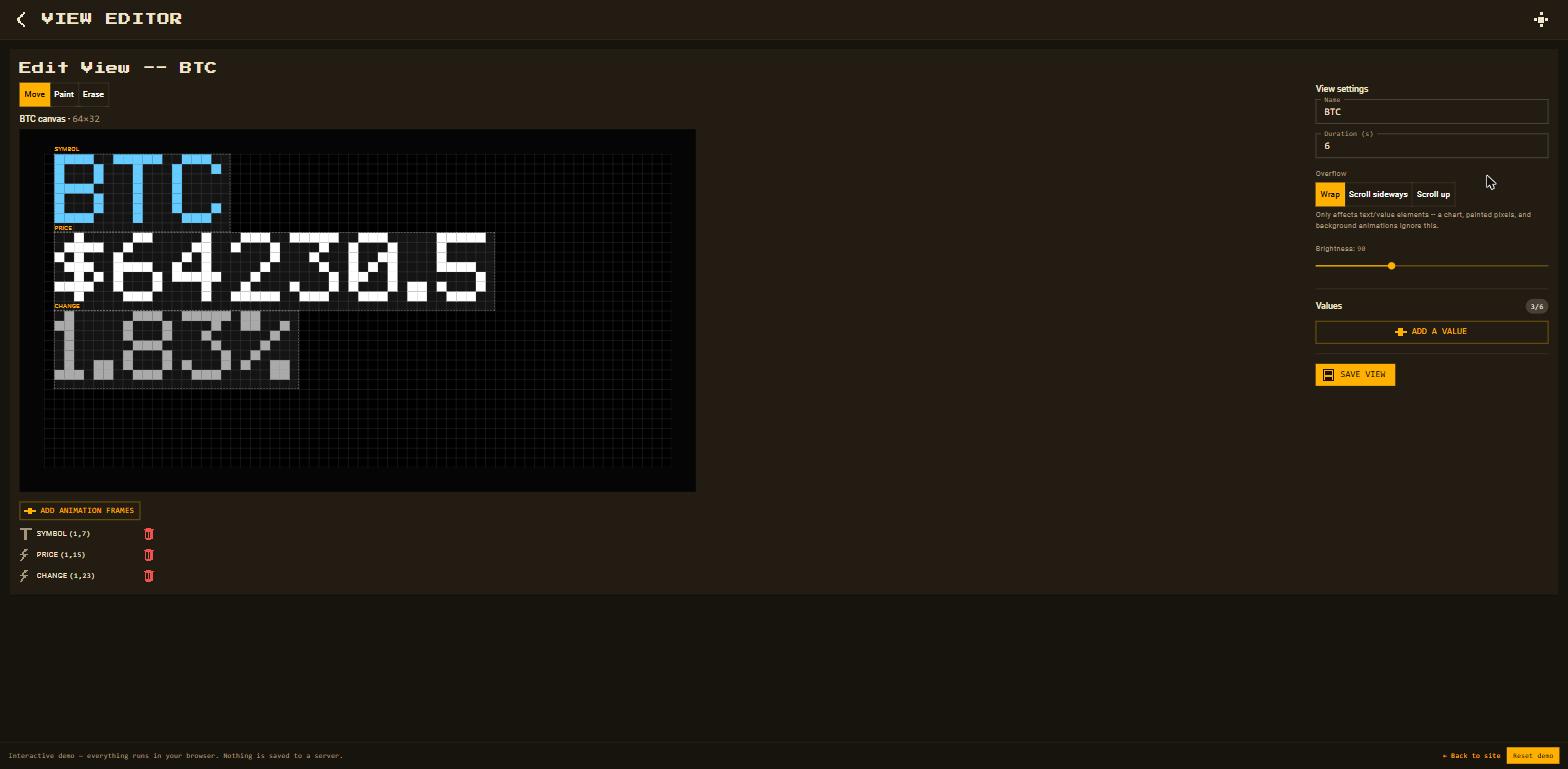
Point it at any JSON API — prices, weather, your own data.
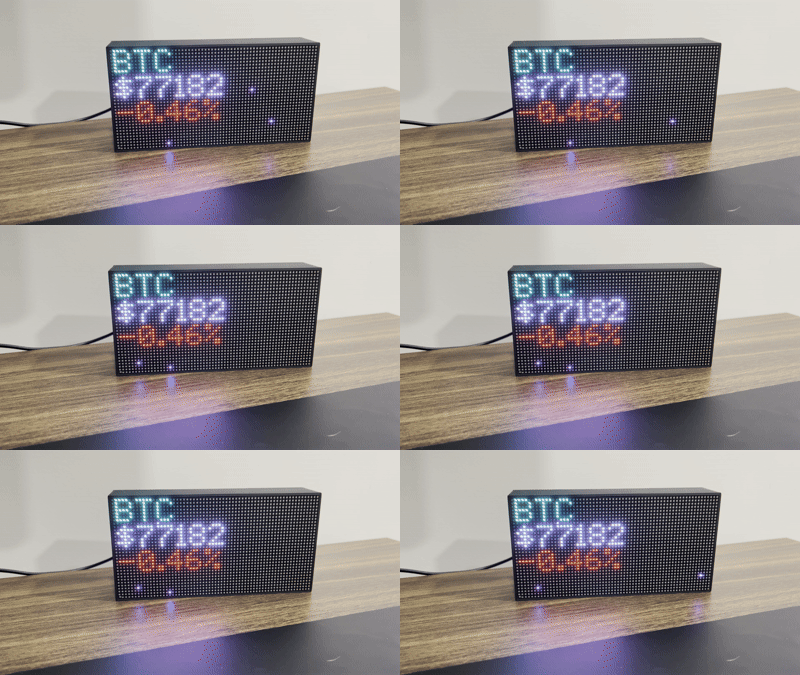
Seconds later, it's live on the panel.
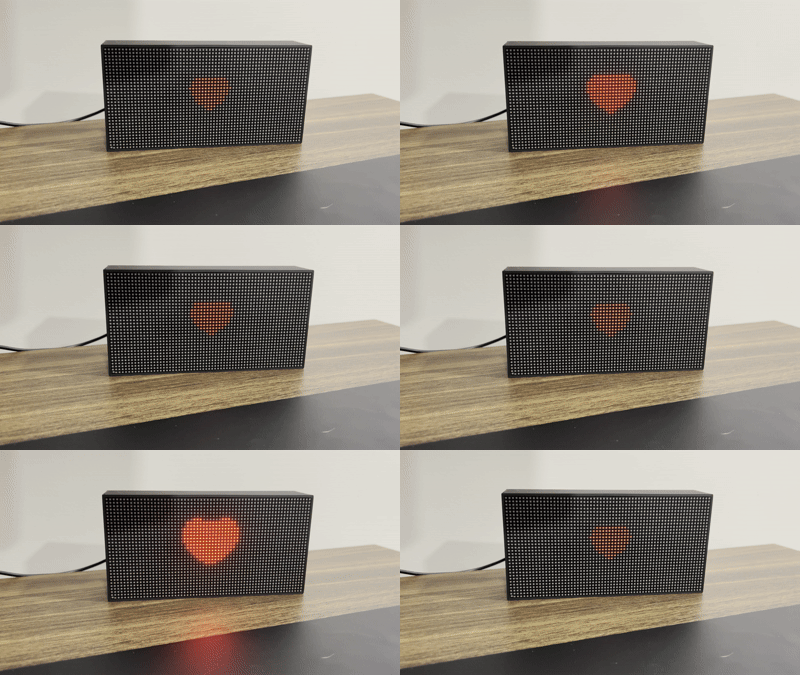
Paint your own pixel art, pixel by pixel.

Or animate it, frame by frame.
An ESP32 LED-matrix ticker you configure entirely from a web page on the device. No app, no cloud account — just your data, on your desk.
Buy DataPixNow live on Kickstarter
We're raising funds to bring DataPix to more desks — back the campaign to lock in early-bird pricing and help us ship the next batch.
Everything on the panel is yours to define
Any JSON API
Add any HTTP endpoint with your own headers, test it live, then click the exact fields to display — formatted, coloured and positioned how you want.
02 · Paint anythingPixel-art editor
A per-pixel canvas with paint, erase and a colour picker. Drop in a sprite and take it over, or start from a blank 64×32 grid.
03 · Animate anythingFrame-by-frame
Draw your own animations one frame at a time, set the speed, and loop them behind your text and data.
04 · Arrange anythingFull per-view control
Drag every element into place. Set colour, size, brightness, on-screen duration and scroll behaviour for each view.
05 · Starting points26 effects · 19 sprites · 11 presets
Guided setups and a library of animations and icons — all editable, none of them a ceiling.
06 · No account, no cloudRuns on the device
The interface is served by the panel over your LAN. It talks only to the APIs you point it at.
What you can put on a view
- Static text — any string, colour and size.
- Live values from any JSON API — pick fields from a
visual tree, format them (
{value:.2f} $), auto red/green for “change” fields. - No-setup providers: clock, countdown, weather, crypto (price + 24h change), stocks (quote + on-panel sparkline chart), and the on-board temperature & humidity sensor.
- Pixel art — paint per pixel, or start from one of 19 sprites.
- Your own frame-by-frame animations (up to 10 frames).
- 26 built-in effects (plasma, fire, matrix rain…) as an animated background.
- Imported GIFs (up to 60 frames) and still images (PNG / JPG / WebP / BMP).
What you control
- Per view: name, on-screen duration, brightness, and overflow — wrap, scroll sideways, or scroll up.
- Up to 6 elements per view, dragged anywhere on the 64×32 grid.
- Up to 30 views, auto-rotating — enable, disable and reorder any of them.
- 11 guided presets to start from; export / import views (or the whole library) as JSON.
- Up to 8 custom API sources, each with its own request headers and poll interval.
- Over-the-air firmware updates (opt-in), plus Wi-Fi setup, timezone and factory reset.
Try the interface in your browser
The real DataPix configuration app, running with simulated data — build a view, paint some pixels, wire up an API, all with nothing to install. Changes stay in your browser.
The device
- Panel
- HUB75 RGB LED matrix, 64×32 by default
- Controller
- ESP32-S3 (16 MB flash, 8 MB PSRAM)
- Setup
- Joins your Wi-Fi; configured from a web page on the device
- Power
- Dedicated 5 V supply for the panel